
Oral film coating weight and thickness mapping before scale-up
Connect dry coating mass, cut area and thickness measurements when reviewing oral dissolving film consistency. Keep the calculation separate from ingredient assay.
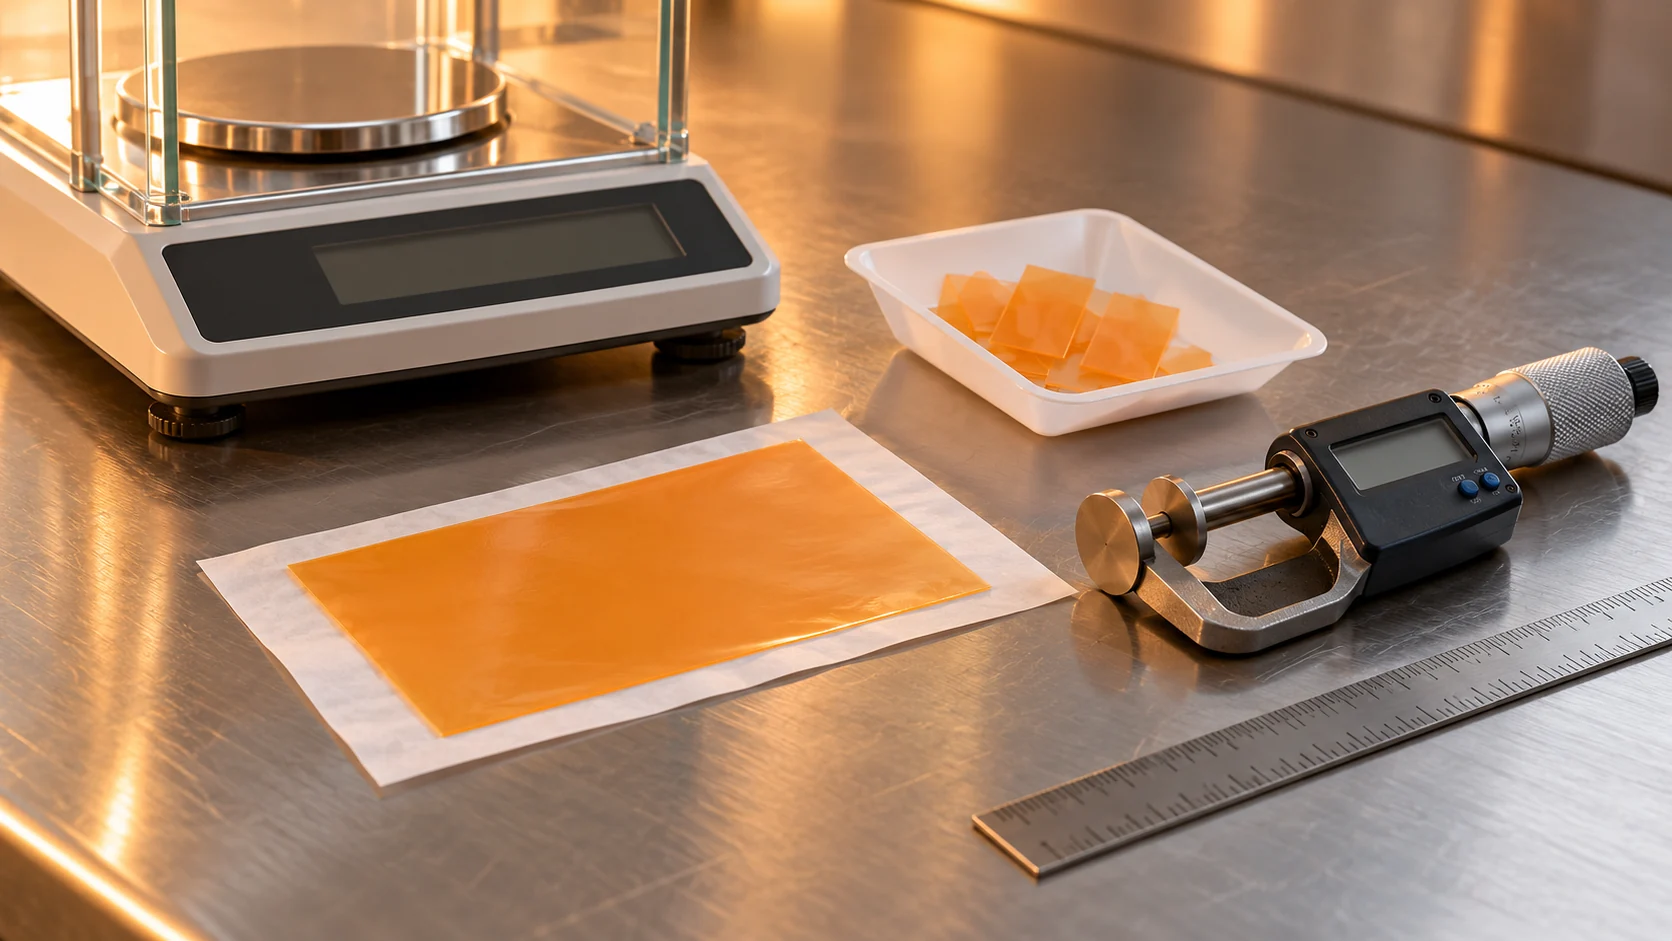
Evaluate coating consistency by connecting the mass of film per unit area, the actual cut area and a location-based thickness map. Use those measurements to investigate the process; verify ingredient content with the agreed analytical method.
The calculations and nine-location example are proposed planning tools using hypothetical values. They are not production records, validated sampling plans or release limits for a HYTANBIO product.
Keep coating mass, thickness and ingredient content distinct
A sheet of oral dissolving film can look even while still needing a more useful consistency assessment. Thickness describes a dimension. Dry coating weight describes mass per area. Ingredient assay describes the amount measured by a suitable analytical method. Record the three together, but do not treat one as an automatic replacement for another.
The distinction matters when a project moves from a small casting surface to a wider or longer process. A single average can conceal where a difference occurred. A map linking sample positions to mass, thickness and analytical specimens makes the evidence easier to investigate.
Use published methods as context for the question
In a 2020 primary study of micronized-loratadine oral films, researchers measured the mass of ten 3 cm² pieces and thickness at three points per piece. They assessed ingredient content separately by HPLC. Those are details of that experiment, not a universal sampling rule. Their separation of physical measurements and chemical analysis is relevant when planning an oral film study. Centkowska and colleagues.
Calculate strip mass with explicit units
Mass per unit area can help connect a coating discussion to the proposed strip dimensions. If dry coating weight is expressed in g/m² and cut area in cm², the nominal strip mass in mg is their product multiplied by 0.1. The factor follows from 1 g = 1,000 mg and 1 m² = 10,000 cm².
A hypothetical six-square-centimeter strip
For an illustrative dry coating weight of 80 g/m² and a cut area of 6 cm², nominal film mass is 80 × 6 × 0.1 = 48 mg. If a uniformly distributed marker represented 10% of that dry mass, its calculated amount would be 4.8 mg. This calculation assumes the declared composition and uniform distribution. It is not an assay result or a suggested consumer dose.
| Hypothetical case | Calculation | Nominal film mass |
|---|---|---|
| Baseline | 80 g/m² × 6 cm² × 0.1 | 48 mg |
| Higher coating mass | 85 g/m² × 6 cm² × 0.1 | 51 mg |
| Smaller cut area | 80 g/m² × 5.7 cm² × 0.1 | 45.6 mg |
In these examples, increasing coating weight from 80 to 85 g/m² increases nominal mass by 6.25%, while reducing area from 6 to 5.7 cm² lowers it by 5%. These arithmetic changes show why coating and cutting records belong in the same review. Ingredient segregation or other formulation effects would require additional investigation.
Separate the wet application from the dry film
A wet applicator gap is a process setting. It is not a measurement of the final dry strip. A development record should identify the prepared mixture, its solids basis, the applied wet quantity and the measured finished film after the agreed drying and conditioning.
For another hypothetical mass balance, applying 200 g/m² of a mixture containing 40% retained nonvolatile solids would imply 80 g/m² of dry solids, assuming those solids are all retained and the backing is excluded. The assumptions belong beside the arithmetic. An actual process needs measurements that account for its materials and losses.
The loratadine study describes casting gaps of 300 and 800 µm as preparation settings and reports finished-film characterization separately. These values describe that research setup; they are not proposed settings for a HYTANBIO nutrition film. Study preparation methods.
Define the specimen being weighed
State whether the release liner has been removed and how samples are conditioned. If film mass is obtained by subtracting a backing mass, describe the subtraction and the backing specimens used. A result including the liner should not be labeled the mass of the oral film alone.
Make a map that can explain a process difference
As an exploratory example, a team might choose left, center and right positions at the start, middle and end of a trial. That creates nine named locations. This is a proposed map for discussing spatial variation, not a statistically justified release sampling plan. The actual plan needs a rationale suited to the process and decision.
- Define a coordinate system or position labels before cutting samples.
- Record the actual cut dimensions and the dry mass at each location.
- Measure thickness at the agreed points using the same contact procedure.
- Link adjacent or otherwise justified specimens to ingredient analysis.
- Keep edge trim, defects and excluded positions visible in the record.
Document micrometer contact geometry, force or the relevant instrument setting, and specimen support. A soft film can respond differently to a different contact procedure. Reconcile the procedures before interpreting two laboratories’ thickness values as a process change.
A 2022 experimental paper on printed orodispersible films examined drying time and physical properties and reported strong relationships between model thickness and film weight in its setup. That supports investigating connected variables; it does not validate the same relationship for a different formulation or casting process. Primary drying-time study.
Translate the map into an investigation and an approval record
Review patterns before making process changes. If one edge differs repeatedly, compare the corresponding coating and drying observations. If mass changes while dimensions remain stable, investigate the coating or specimen basis. If measured ingredient amounts vary without a matching physical pattern, the analytical and formulation investigation remains open.
Define the decision criteria before using the trial to approve a process. A visually appealing map or a narrow average does not establish that every ingredient meets its agreed criteria. Retain individual results, methods, specimen locations, deviations and the rationale for any further sampling.
Use the COA and content-uniformity guide to plan the analytical evidence. Carry the map and specimen definitions into pilot-to-commercial transfer, and connect conditioning questions to the moisture measurement guide.
For a quotation or development brief, describe the planned cut area and the consistency question the trial must answer. That gives the manufacturer a clearer task than an isolated request for a “thin, uniform strip.”
Sources and scope
- Centkowska, Lawrecka and Sznitowska, Pharmaceutics 2020, 12(3), 250; DOI 10.3390/pharmaceutics12030250. Primary experimental descriptions of casting, mass, thickness and content measurements.
- Effects of Various Drying Times on the Properties of 3D Printed Orodispersible Films, Pharmaceutics 2022, 14(2), 250; DOI 10.3390/pharmaceutics14020250. Primary printed-film study; process-specific findings are not universal film specifications.
References checked October 30, 2026. The cited research and standards have their own scopes. The proposed review tools are editorial applications, and no endorsement by the cited organizations is implied.
Frequently asked questions
Does equal oral film thickness prove equal ingredient content?
No. Thickness is a physical measurement. Ingredient distribution and content need evidence from the agreed analytical method and sampling plan.
How is nominal strip mass calculated from coating weight?
For dry coating weight in g/m² and cut area in cm², multiply the two values by 0.1 to obtain mg. The calculation needs a stated specimen and dry-mass basis.
Is a wet casting gap the final oral film thickness?
No. The wet applicator setting and the conditioned dry-film measurement describe different stages. Record both instead of treating them as the same value.
Is a nine-location map a standard release test?
The nine-location arrangement in this guide is an illustrative planning example. Establish and justify the actual sampling plan and acceptance criteria for the process and intended decision.